
Tender Rhythms
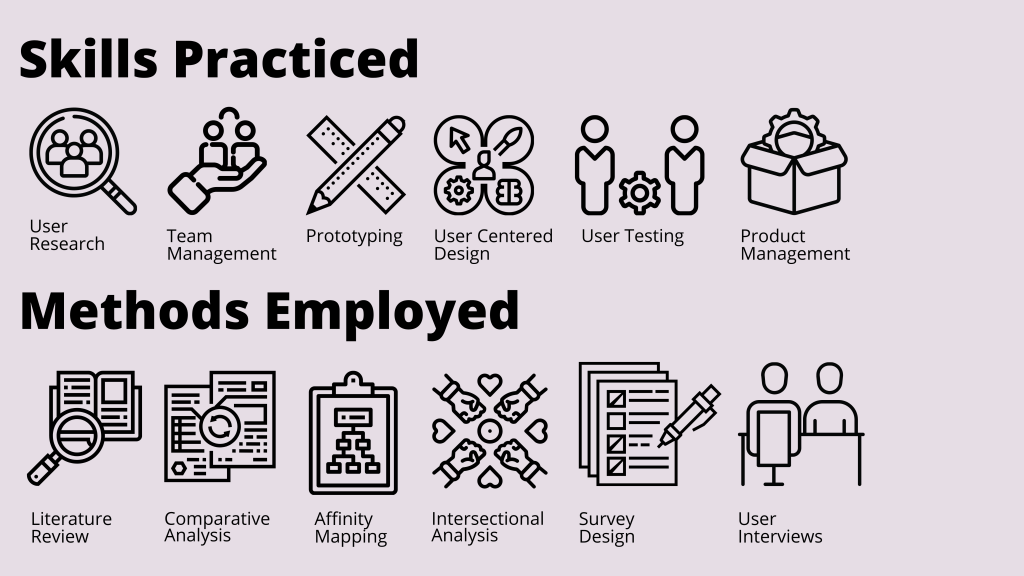
TRANSLATING A PHD DISSERTATION INTO AN INTERACTIVE PRODUCT BASED ON UX RESEARCH PRINCIPLES
THE STORY OF TENDER RHYTHMS
How A Dismissed Problem Became the Cathalyst Behind my PhD and BCI Product
HOW IT ALL STARTED
My Desire for Romantic Connection Kept Getting Dismissed as Feminine, Hysteric, Infantile, or Frigid.
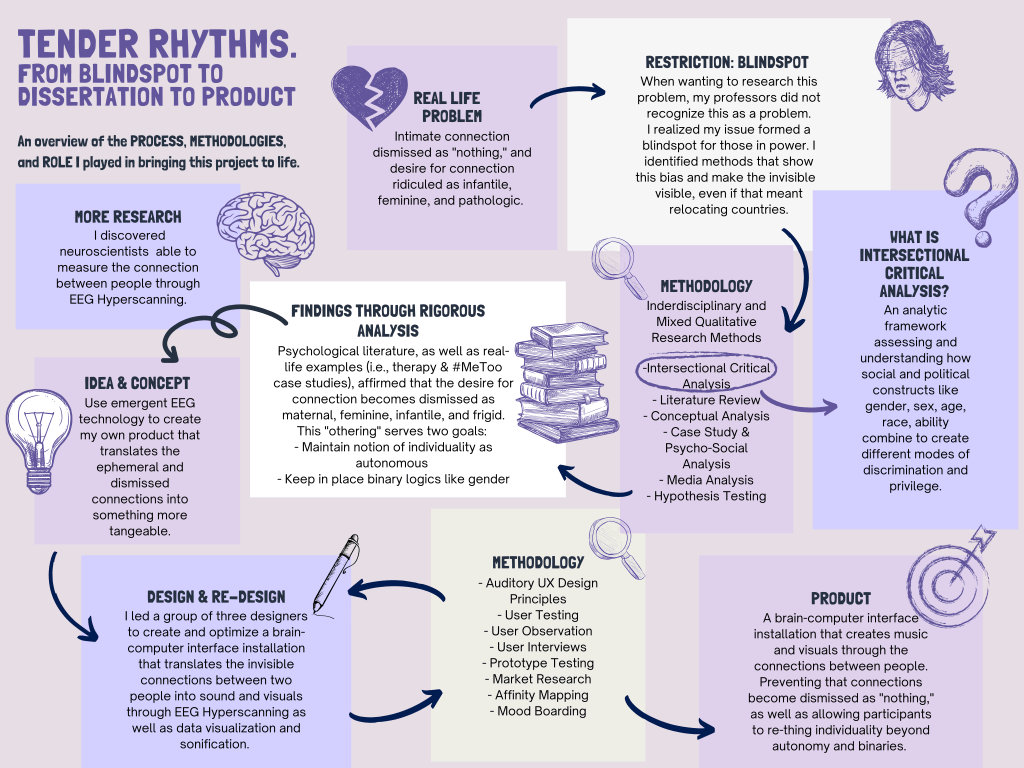
My research journey started with a Real Life Problem. Both privately – my lovers – as well as scientifically – the professors and researchers I spoke to and who’s work I was reading as a philosophy student – demonstrated a bias against the importance of human connection. “You give me nothing,” said my back-then-boyfriend, when I ended up preferring connecting caresses over disconnected sex. “They are frigid women, who linger in fore-pleasure and can’t give their husbands what belongs to them,” wrote Freud in 1905 and my partner and professors agreed.
As a UX researcher avant la lettre, I conducted my own Critical Analysis and came to the conclusion that I needed to obtain feminist research skills to debunk this gendered and ageist bias against connection. My Market Analysis showed me that (at that time) only in the U.S. there were Ph.D. programs in both gender and sexuality studies interested in this kind of research. Since I could not find the answers in my country, I packed my bags and moved across the ocean.
What is So Threatening About Human Connection? It Dismantles Notions of Autonomy and Gender.
Through Interdisciplinary Qualitative Research, like Comparative Literature Analysis, as well as Conceptual Analysis I noticed a trend in Western literature and science to refer to moments of deep connection and merger with words like “maternal,” “infantile,” “emasculate,” “primitive,” “hysteric,” “asexual,” “too much,” “sentimental,” etc. My Intersectional Critical Analysis, allowed me to conclude that in Western society intense connection becomes gendered/feminizes, aged/infantilized, pathologized, and even racialized.
A closer look at psychological Case Studies, as well as my Sociological Research and Observations of Hookup culture – based on the split between sex and affectionate connection – and my Media Analysis of internet and newspaper articles on the #MeToo movement, showed me that the bias against connection is alive and well, and goes beyond purely historic and scientific literature.
But what is so threatening about human connection? When faced with such a big research question, the first step is to Identify a Fixable Problem. Through more Interdisciplinary Qualitative Research, I discovered that the bias against connection went hand in hand with the Western definition of adulthood as autonomous and sovereign individualism, as well as with binary logics – like self/other, me/you, masculine/female, black/white – as the default structuring principle of our Western society.

What happens when something is threatening? It becomes “othered,” in this case intense connections become othered as feminine, infantile, or pathological (frigid). Now that I had an identifiable problem – hybrid connections become othered to maintain core Western ideology of sovereign individualism and binary structures – I was able to turn to my colleagues to come up with a design solution for this problem.
LEADING A TEAM OF DESIGNERS TO TRANSLATE MY ABSTRACT RESEARCH INTO A TANGEABLE PRODUCT
Step 1: Transforming Connections into Sound
During my Qualitative Research, I discovered Neuroscientific Research that was able to measure the invisible connections between people. Using the data-visualization technique of EEG hyper-scanning, they discovered that during moments of social bonding and connection, the alpha-brainwaves of participants synchronize, forming a 2-in-1 system that transcends the sum of its parts. Eureka! I had found an existing yet Emergent Technology that would allow me to give a voice to the so often dismissed connections between people.
I utilized my network and teamed up with sonification designer and engineer Dr. Mike Winters. Together, we created an interactive brain-computer interface installation, based on Quantitative Data Collection, which Translates Bio-Feedback Data – the connection, or alpha brainwave synchronization between people – into music. As such, our design can also be referred to as an Auditory UX (AUX) for dyads engaged in a simultaneous and primary face-to-face interpersonal interaction.
The Design Challenges of Working with Emergent Technology – Hardware
One of the challenging requirements for our study was achieving a quality EEG signal in a relatively short amount of time. The time constraint arose out of our desire for the system to be used in succession by groups of interested dyads in an installation or exhibition setting.
Traditional “wet” and “messy” cappings of EEG systems for scientific experiments and medical monitoring can require 15-30 minutes or preparation and an additional 15 minutes for clean-up. New “dry” systems require less preparation and clean-up time, but can also be less reliable in terms of signal quality.
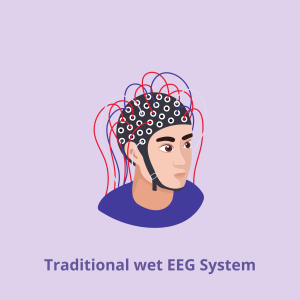
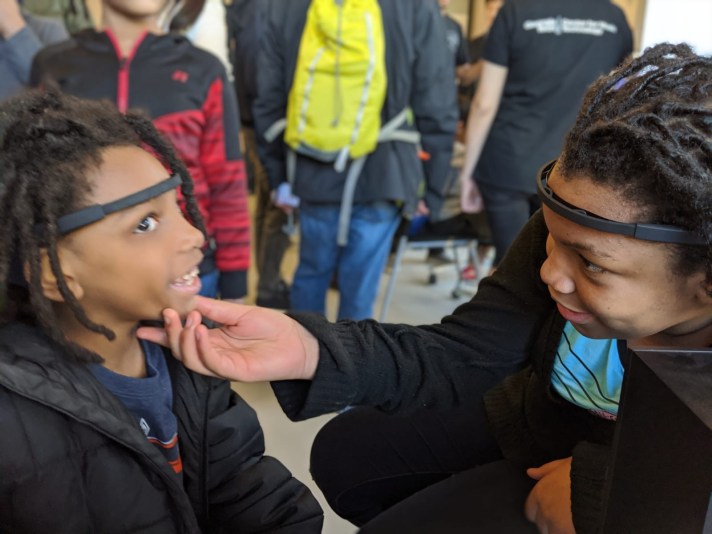
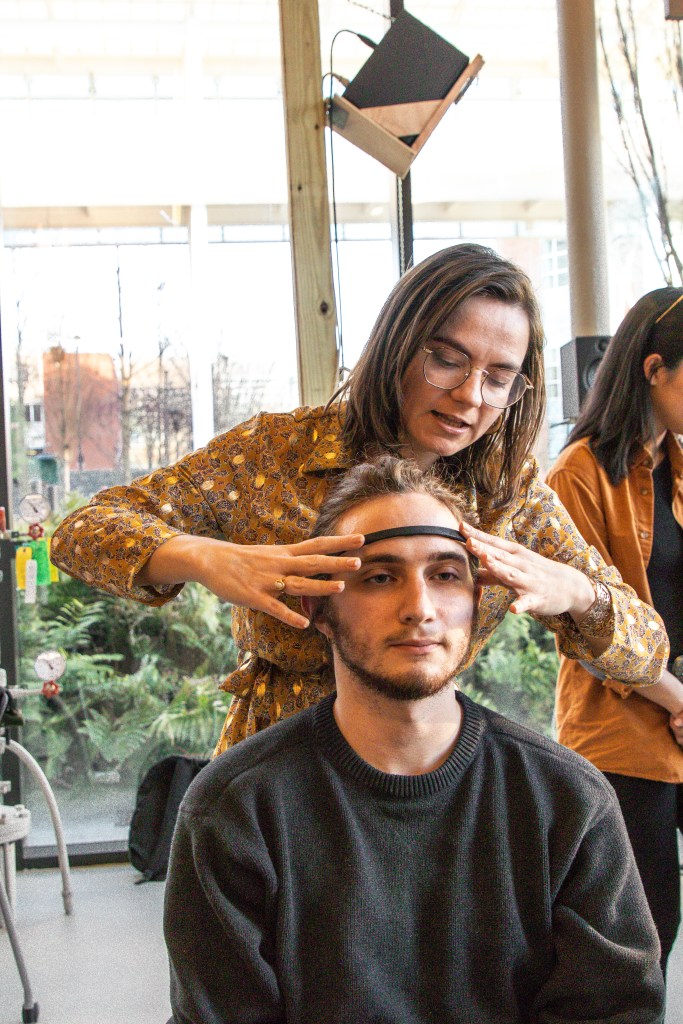
In addition to these primary constraints, we also wanted our system to be portable, wireless, and inexpensive, so that the system would be mobile, simple to set-up, and financially accessible. These constraints ultimately led us to the Muse EEG headset. Using these headsets, we could typically achieve the required signal quality in less than five minutes on members of the general public. Furthermore, they operated on battery charges and sent information wirelessly.
Here is a video of Dr. Michael Winters and me trying out our first proto-type of the AUX BCI-Installation, using the Muse EEG headbands.
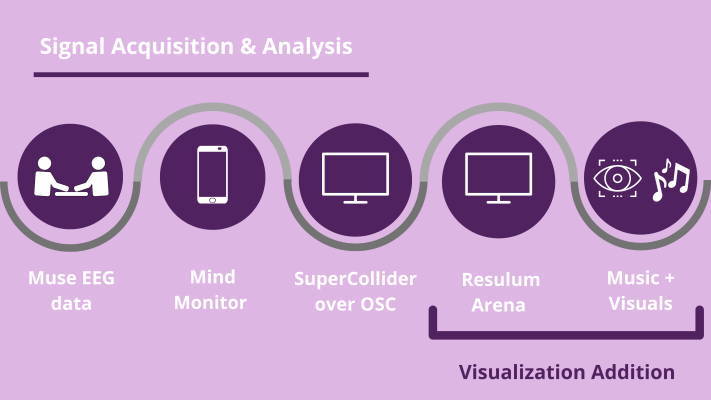
Interactive Computational Design – Signal Acquisition & Analysis
To acquire the EEG data from the headset, we made use of the Mind Monitor application that was specifically built for the Muse EEG headsets. After connecting to the Muse headsets over Bluetooth, we used built-in functions of the software to lower impedance values, identify useable signal, perform basic EEG cleaning, analyze spectral power in frequency bands, and send information to SuperCollider over Open Sound Control (OSC).
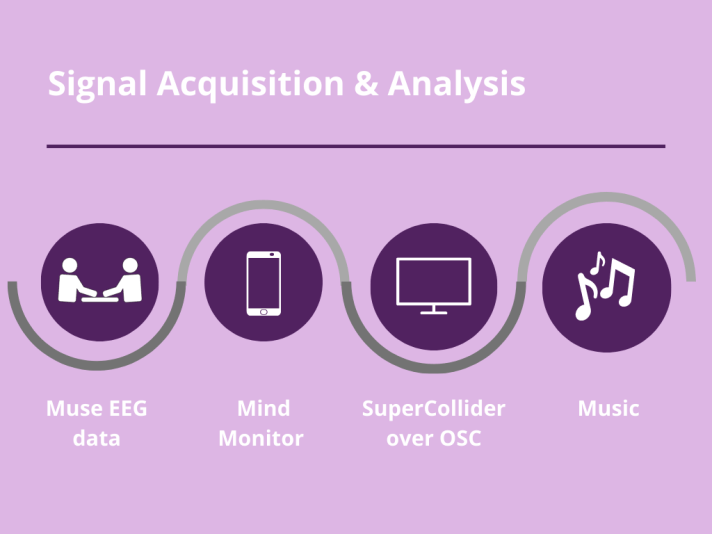
Scientific hyper-scanning studies typically apply sophisticated time-domain algorithms to quantify the similarity and causality across multiple EEG sensor positions offline. However the Mind Monitor application does not offer those functions by default. Instead, information is available in “Raw Data” form, or as spectral power over the typical EEG frequency bands (i.e. Delta, Theta, Alpha, Beta & Gamma). Following other approaches to real-time hyper-scanning instruments, obtained by our Neuroscientific Literature Review and Research, we decided to create our similarity metric from the spectral power in EEG Alpha frequency band. We viewed this as a simple and robust approach, that could be directly linked to the level of attention. The two headsets were connected over a local Wi-Fi network to a laptop running SuperCollider. Supercollider received the global Alpha power of each individual headset, calculated the similarity metric, and applied this similarity to the Sonification Mapping.
Using Auditory UX (AUX) Research to make our product more User Friendly.
Participants needed to understand the meaning of changes in an ambient “always-on” sound. We leveraged a subset of the BUZZ: Auditory Interface User Experience Scale as design objectives. Specifically, we wanted the auditory interface to be:
Easy to Understand
To help new users quickly grasp what our sounds were conveying, and also to limit the amount of auditory attention required to make sense of these changes.
Pleasant
Like background music in films, its purpose was to enhance and extend the existing visual and verbal context, while simultaneously not to annoy or bore the participants.
Relatable
To match user’s sonic expectations for the underlying data concept. The hardest of our objectives — because what does a connection sound like?
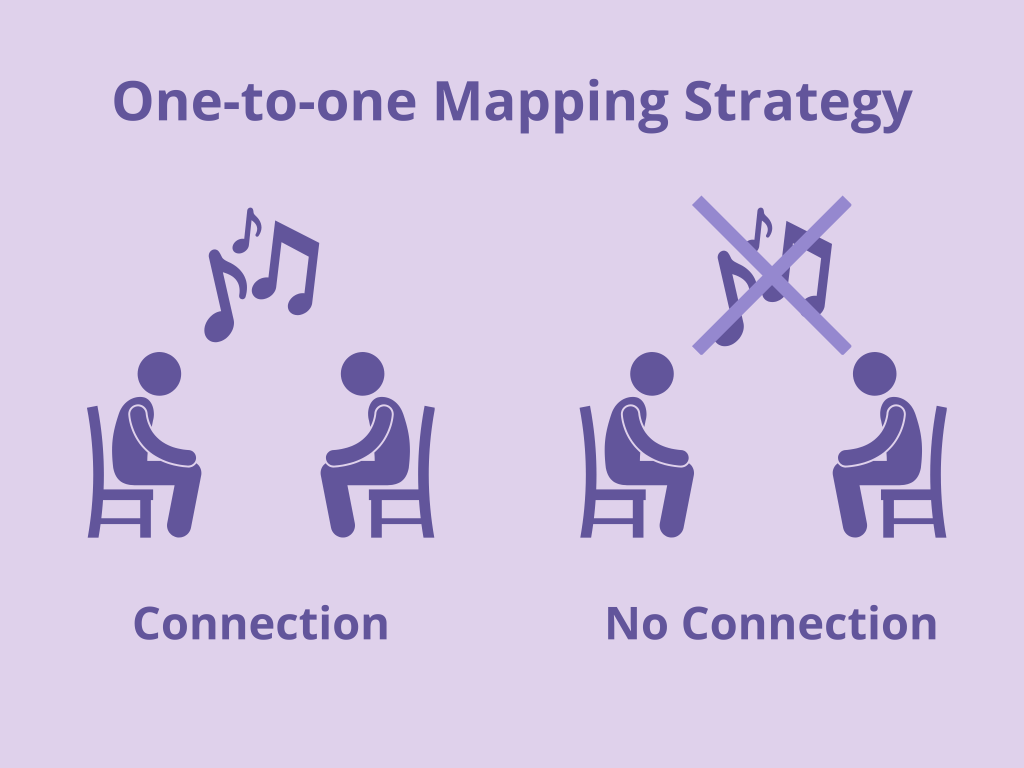
To meet these AUX design objectives, we explored multiple data to sound mappings. For the purpose of being easy to understand, we decided to use a simple one-to-one mapping strategy, so that only one aspect of the sound would change with the underlying data. Although there are multiple possibilities for the acoustic cue (e.g. harmony, pitch, tempo, volume, timbre), we ultimately decided on volume.
We reasoned that a silence/music continuum might make a relatable mapping for brain-similarity. For example, with a volume mapping, we could explain to users: “When your brainwaves are similar, you will hear music.”
Concept Testing our Prototype
To pick the ultimate sound, we used the methods of informal interviews, with technologically minded listeners unfamiliar with the project to determine which sound sounded most Relatable as well as Pleasant. To choose the sound, we composed six sounds that we felt were relatable to brainwaves and would be pleasant over long periods of time. After giving them ample time to play through the different sounds, we asked them which sound sounded the most “like brainwaves” and why.
From their responses, we found that sounds that included a small amount of low-frequency amplitude modulation best mapped the cognitive model of brainwaves and we selected their top choice for the timbre of the continually looping musical clip. During our first public showing of the installation, we combined the methods of User Observation and User Testimonials with participants, to refine the sound and optimize its relatability.


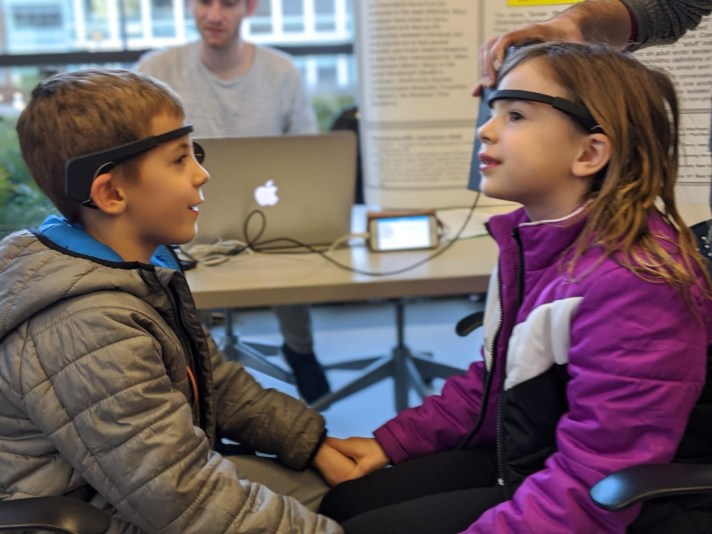
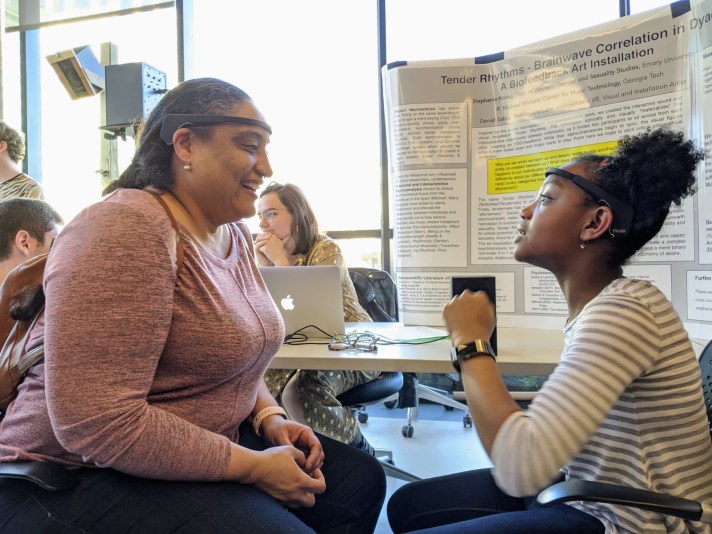
Users Testing our Prototype at the Georgia Tech Music, Art, and Technology Fair (2020).
Step 2: Translating Connections into Visuals
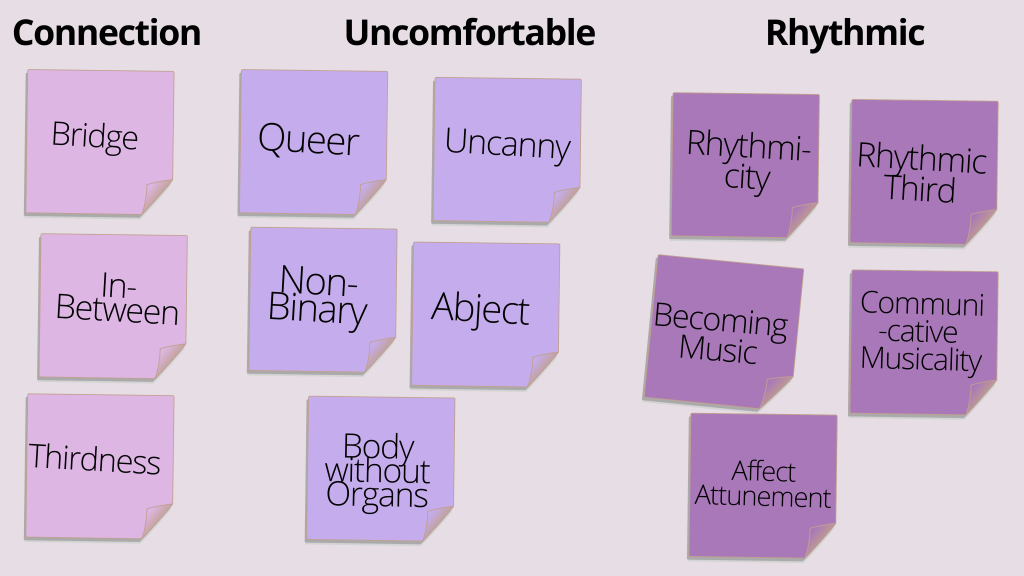
After careful Analysis of User Testimonials of the First Prototype, I decided to add a Data Visualization element to the BCI Installation. To reach my goal, I flew to Berlin to start my collaboration with conceptual new media artist Daniel Sabio, a.k.a. The Glad Scientist. Our design challenge was to tackle the question: “What could the invisible connection between people look like?” To tackle this challenge, we started with an Affinity Map of all key concepts I had found through my rigorous Interdisciplinary Literature Review and Analysis of Philosophy, Psychoanalysis, Psychology, Feminist Theory, Queer Theory, and Neuroscience research that described this connection. We then narrowed our Design Parameters down to three key concepts: Connection, Uncomfortable and Rhythmic.
Additionally, I wanted the visuals to represent what happens right before we connect – the transition from being closed to becoming open. I told Danny about the recurrent literature that describes vulnerability and becoming-porous as a precondition for deep connection. And I wanted him to keep the famous Hemmingway/Rumi/Dylan quote in mind: “There is a crack in everything, that is how the light comes in,” which I accompanied with a Visual Mood Board.

For the First Visual Prototype, we decided to represent the two participants by floating neutral bodies. Once the connection occurred, the bodies would explode and a grey moving tube-like cloud would appear. This first prototype can be found in the following demo video.
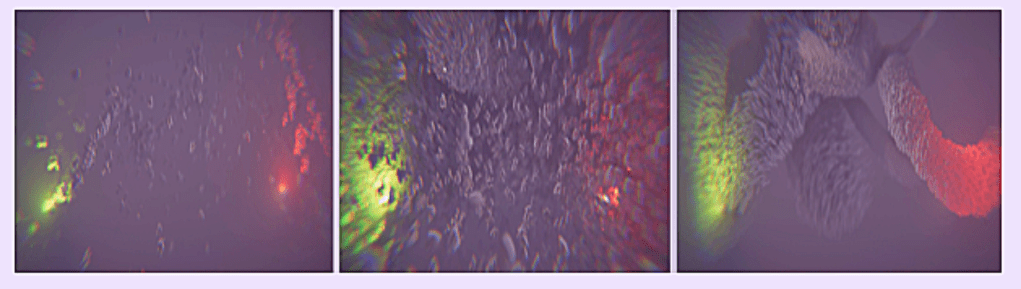
Through conversations with Danny and as I became more aware of the Principles of Inclusive Design, I assessed that the representation of the participants by so called “neutral” bodies, would always exclude some. We therefore reevaluated our visual choice and decided to go for a more abstract approach. We landed on a visual design in which one participant is represented by a red light and the other by a green one. Without a connection, small grey rocks float between them, representing their attempt to connect. Once the connection starts, the rocks explode. This represents their becoming-open. Finally a grey tube, connecting the green and red light, visualizes the height of their connection.
Interactive Computational Design – Signal Acquisition & Analysis
To keep the design simple, Danny decided to work with the existing instrument and merely add one step. The real-time EEG data retrieved from Mind Monitor and SuperCollider would flow to the VJ Software and Media Server Resulum Arena, to generate visuals that correlate with the sound mapping.
In this next video, you can see me and my partner Nyle play around with the second rendition of the BCI Installation. If you pay attention, you can hear the sound increase and the visuals change when both of us are at the height of our connection.
Step 3: Adding a Sculptural Element to Tackle a Spatial Problem
Projecting the visuals on a wall next to the two participants created a spatial problem. The participants had to turn their heads to see the visuals, losing their mutual gaze and running the risk to lose their connection. In a third and for-now final iteration of the installation, I consulted installation artist Eddie Farr to add a sculptural element to the installation.
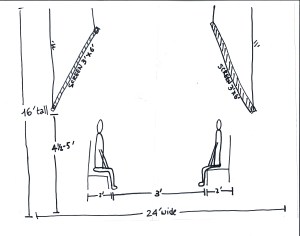
With the guidance of Eddie, and to keep the design cost-effective, I designed and created two large screens myself. These screens would hang behind the participants. Through projection-mapping, they would be able to see the changing visuals projected above the other participant. To keep the screens at a minimum weight, not to damage any ceilings, the screens were constructed from ripstop nylon, fiberglass rods and 3D-printed connectors.
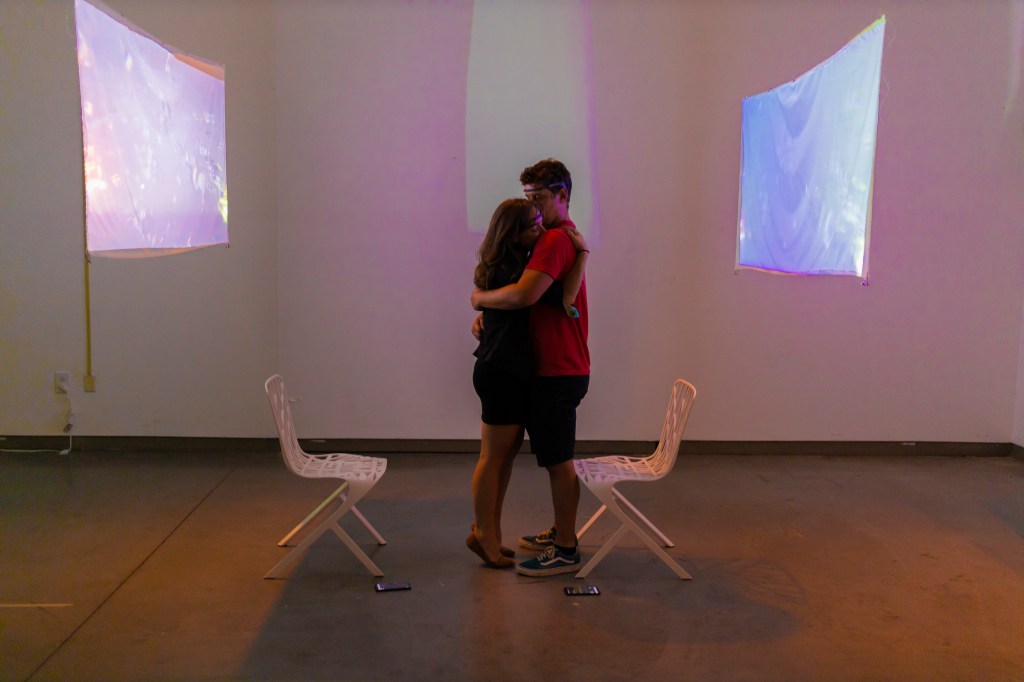
During the exhibit at Emory’s Visual Arts Gallery from July 29, 2021 until August 1st, 2021, this last iteration of Tender Rhythms was displayed and over one hundred individuals participated.


THE PRODUCT
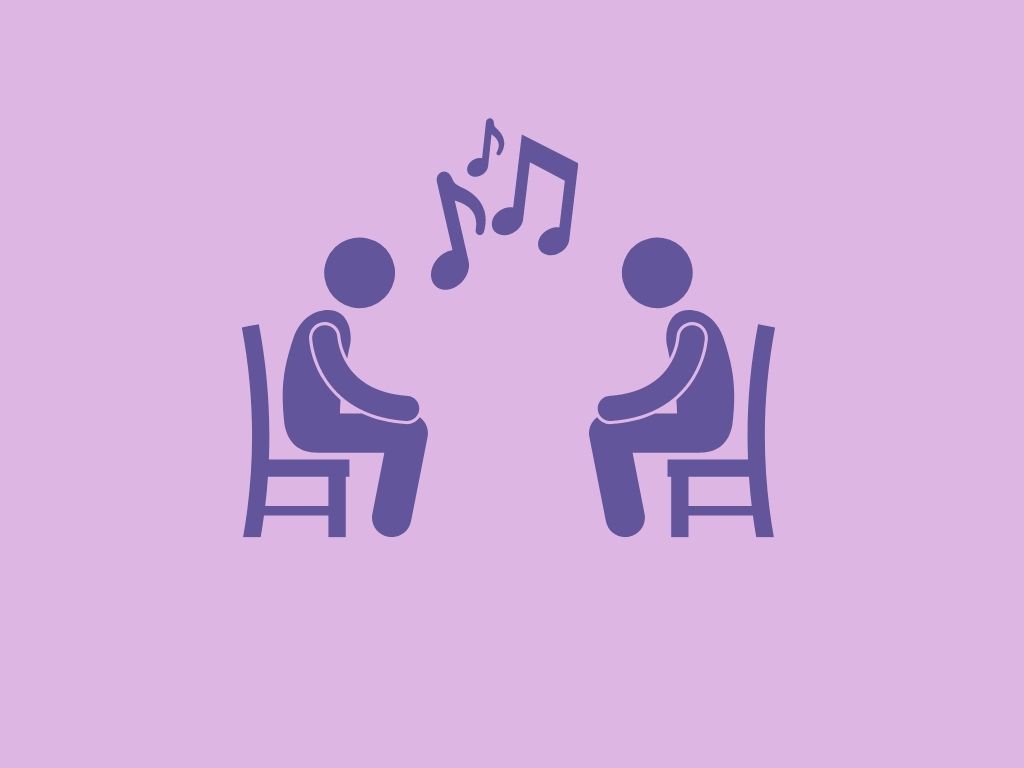
An Award-Winning Brain-Computer Interface (BCI) Installation that Translates the Invisible Connections Between People into Music and Visuals.
Humans connect all the time, and yet we can’t see these connections. Connections are stuff of intuition and gut feelings. But that poses a problem in a world dominated by the visual. Connections can often become dismissed as “nothing,” or a matter of “my word against yours.” Based on interdisciplinary scientific research, as well as UX sonification design principles, I lead a team of two designers to create a product that translates the invisible connections between people into sound and visuals. Based on user testimonials, user observation, and user interviews we kept perfecting the UX sound and visual component of the product, until its final shape in the form of the Brain-Computer Interface Installation Tender Rhythms.

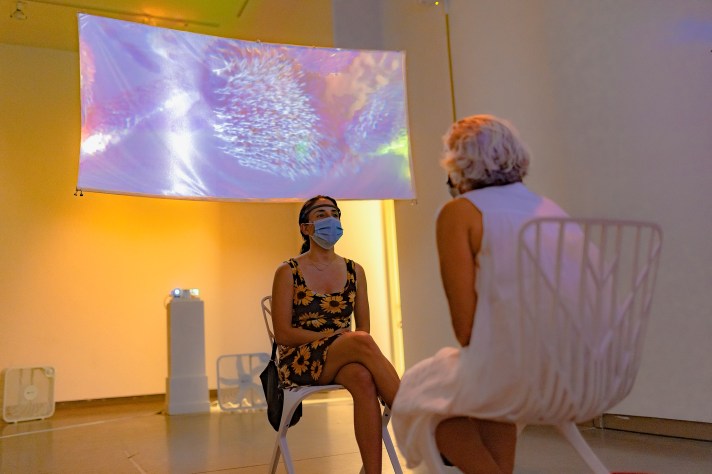


Tender Rhythms at the Emory Visual Arts Gallery (July-Aug 2021)
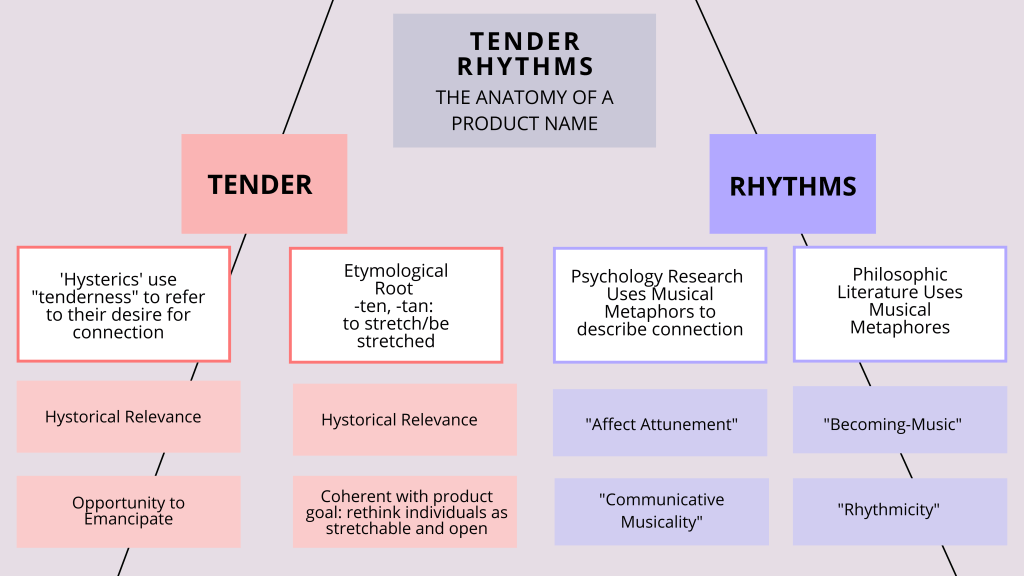
Coming up with a Product Name – Tender Rhythms
My research journey started with the pull to emancipate our desire for close connection. Throughout my PhD Research I discovered a myriad of ways in which this desire becomes dismissed. Simultaneously, I discovered recent research that started to give words to this interpersonal connection, yet without recognizing the biases and struggles. I wanted the name of our BCI installation to reflect both these historically rooted challenges, as well as the promising contemporary research.
My extensive Literature Review showed that the first psychological works referred to this desire as Tenderness. This was a word used by Freud’s first patients, women he called “hysteric,” because their desire for connection was so called “infantile,” “feminine” and “pathologic.” It was important to me to hold on to this original concept of tenderness and to emancipate it. This is the first reason why I picked to word “tenderness.”
Further Etymologic Research revealed that tenderness is derived from the Proto-Indo-European -ten, -tan: to stretch or to be stretched. I wanted Tender Rhythms to represent the “tenderization” or the “becoming-stretchable” quality of our individuality, in moments of deep connection.
Finally, my Comparative Interdisciplinary Research showed how the most common way to refer to the dynamics of moments of deep connection, are metaphors of rhythmicity and musicality. This is why I wanted to put “rhythms” in the product name. Coincidentally, the word tenderness too had an implicit reference to rhythm, as -ten -tan is also at the root of musical words like tone, tune and dance.
Reception
The success of Tender Rhythms can be illustrated by the handful of Awards, Prizes and Fellowships it won. Among these there is The American Psychology Society’s “Stephan Mitchell Paper Prize,” The International Psychoanalytic Society’s “Sacerdotti Award,” and The Neuropsychoanalytic Society’s “Best Poster Award.” Tender Rhythms has also been funded by Fellowships like the prestigeous Fulbright Fellowship, or the Emory University Center for Mind, Brain, and Culture Summer Grant.
Tender Rhythms was also featured on NPR (the North American National Public Radio), and artist and YouTuber Benn Jordan featured the installation on his Channel.
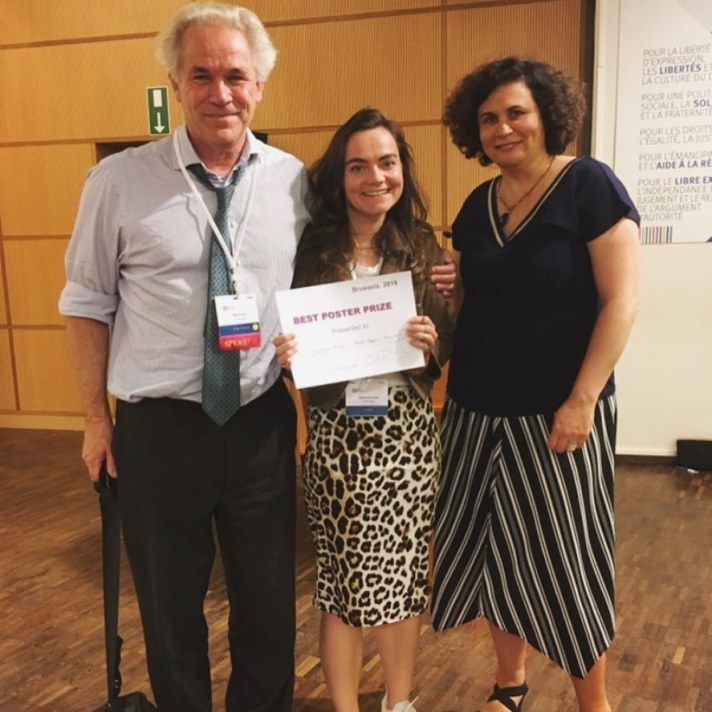
Me holding the “Best Poster Prize,” at the Neuropsychoanalysis Society Conference in Brussels (2019).
WHAT’S NEXT?
Optimizing the Product Through More UXR
I Designed a User Survey and asked participants to fill it in after taking part in Tender Rhythms. So far 26 users did, and the answers are overwelmingly positive. To the question “How did the product make you feel?” they responded with a variety of words, from “connected” and “happy,” to “akward” and “nervous.” The Word Cloud bellow visually represents their answers. The bigger the word, the more users used it to describe their experience.

When asked “would you like to do this again?” “did you respond to the visuals and/or sound?” and “did the installation make you reconsider notions about individuality as autonomous and binary?” the data confirms that we are on the right track:
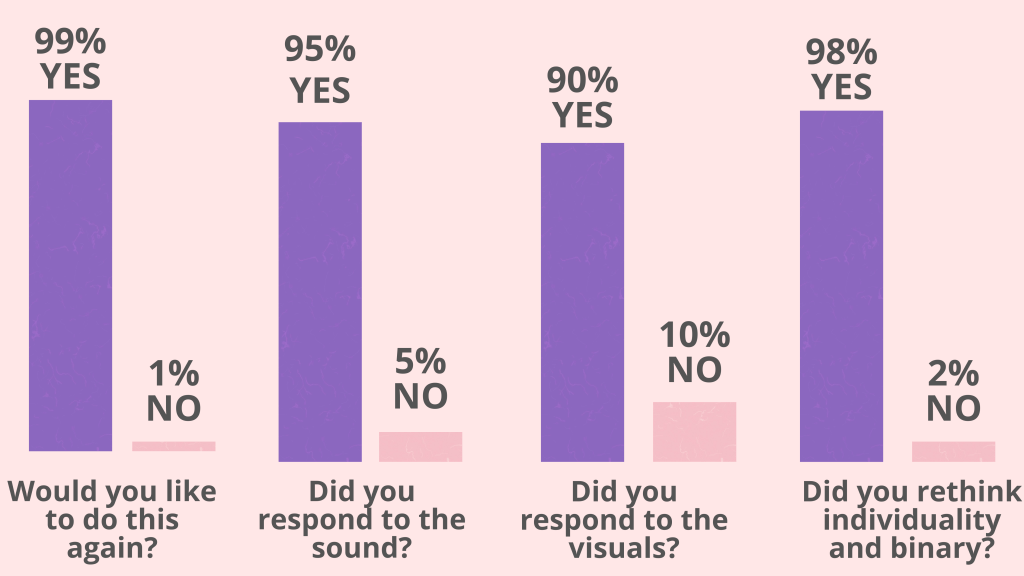
More in-debt questions about the specific sound and visual design, offered us a handful of user suggestions to optimize these aspects of the product. We will incorporate this feedback as we further improve and tweak our BCI installation, always with the user experience at the heart of our design.
